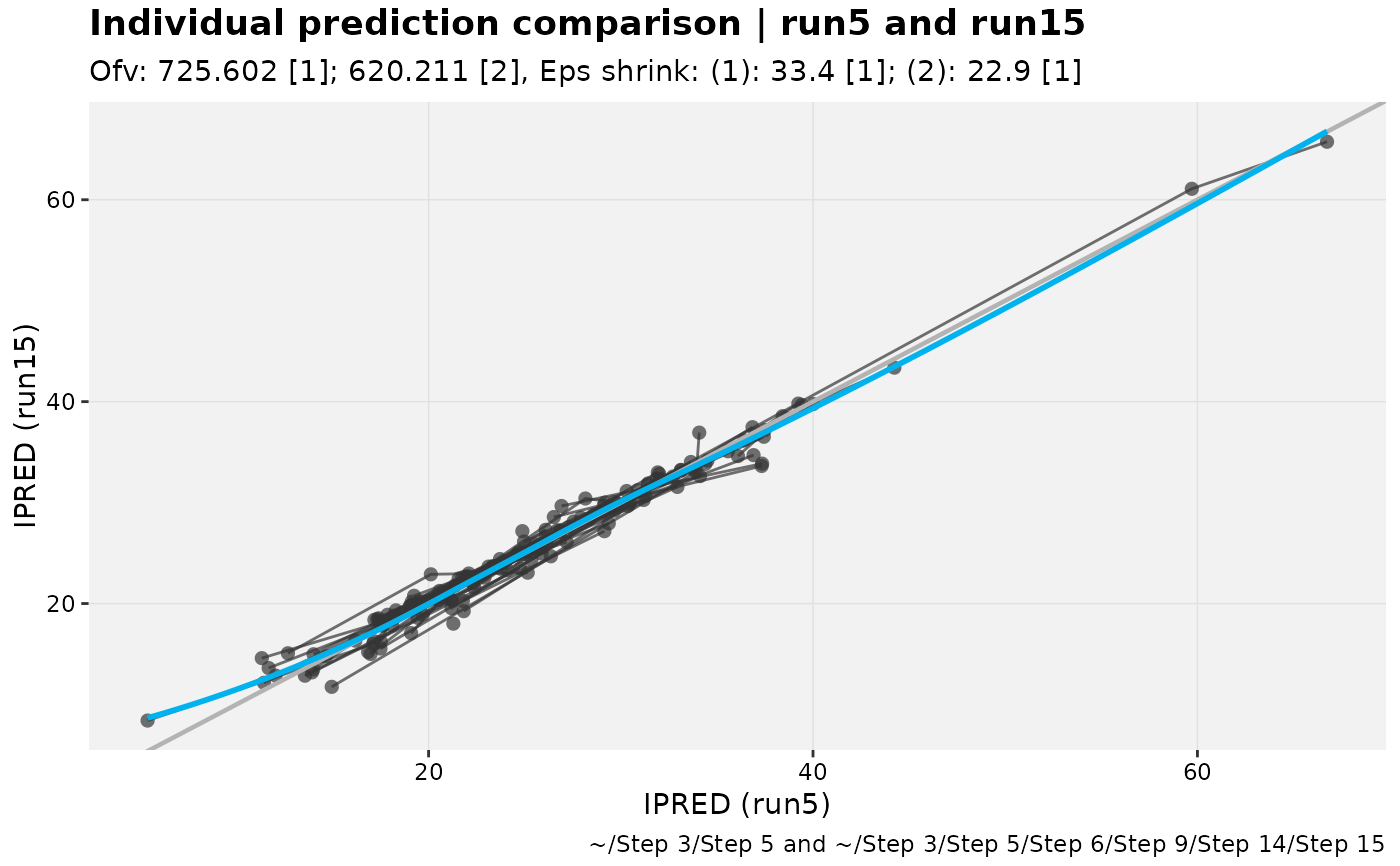
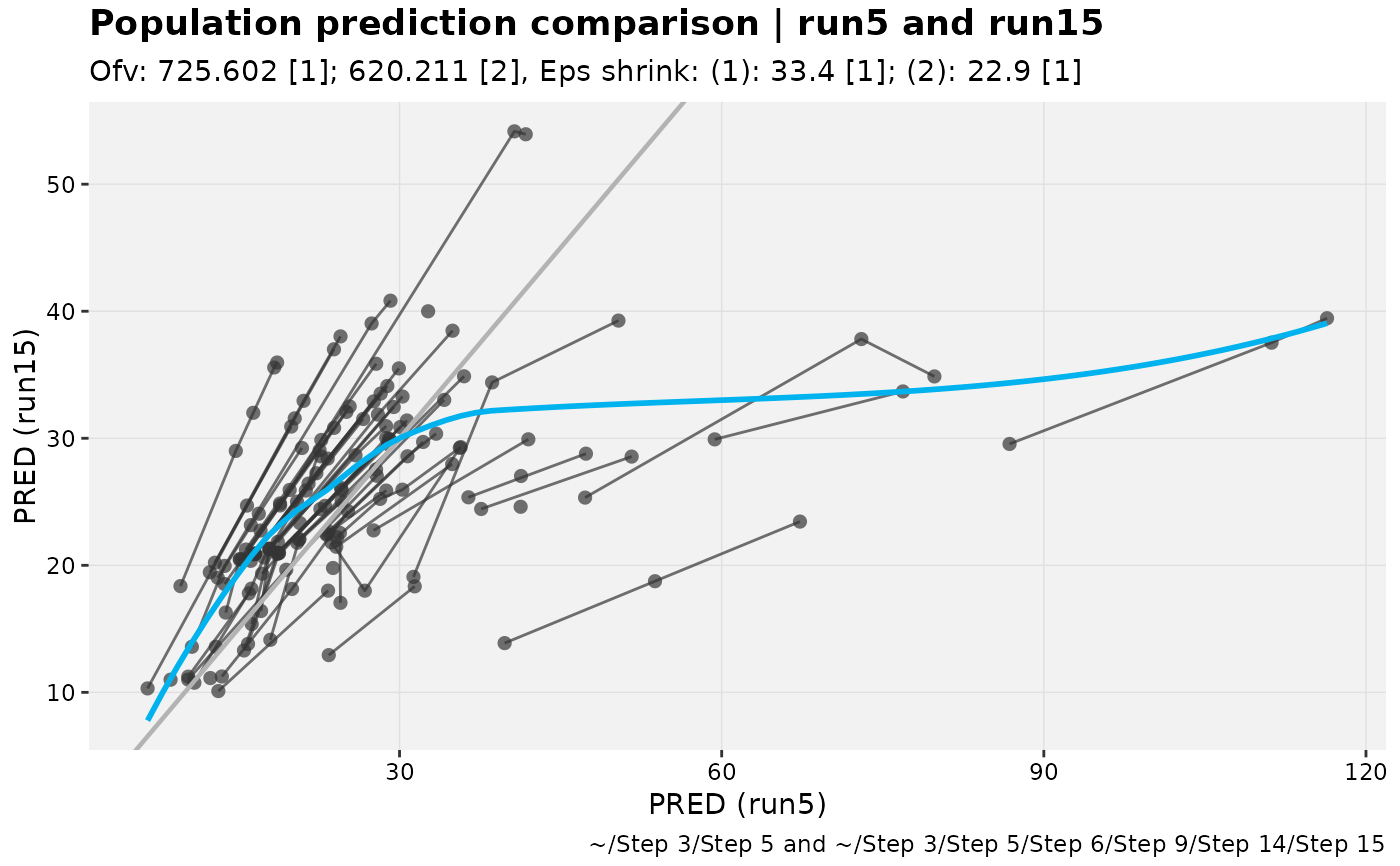
For two models in an xpose_set, these functions are useful in comparing individual
and population predictions
Usage
ipred_vs_ipred(
  xpdb_s,
  ...,
  .inorder = FALSE,
  type = "pls",
  title = "Individual prediction comparison | @run",
  subtitle = "Ofv: @ofv, Eps shrink: @epsshk",
  caption = "@dir",
  tag = NULL,
  log = NULL,
  guide = TRUE,
  axis.text = "@run",
  facets,
  .problem,
  quiet
)

pred_vs_pred(
  xpdb_s,
  ...,
  .inorder = FALSE,
  type = "pls",
  title = "Population prediction comparison | @run",
  subtitle = "Ofv: @ofv, Eps shrink: @epsshk",
  caption = "@dir",
  tag = NULL,
  log = NULL,
  guide = TRUE,
  axis.text = "@run",
  facets,
  .problem,
  quiet
)
Arguments
- xpdb_s
<
xpose_set> object- ...
See <
two_set_dots>- .inorder
See <
two_set_dots>- type
Passed to
xplot_scatter- title
Plot title
- subtitle
Plot subtitle
- caption
Plot caption
- tag
Plot tag
- log
Log scale covariate value?
- guide
Add guide line?
- axis.text
What to show in the axes to distinguish the model values
- facets
Additional facets
- .problem
Problem number
- quiet
Silence output