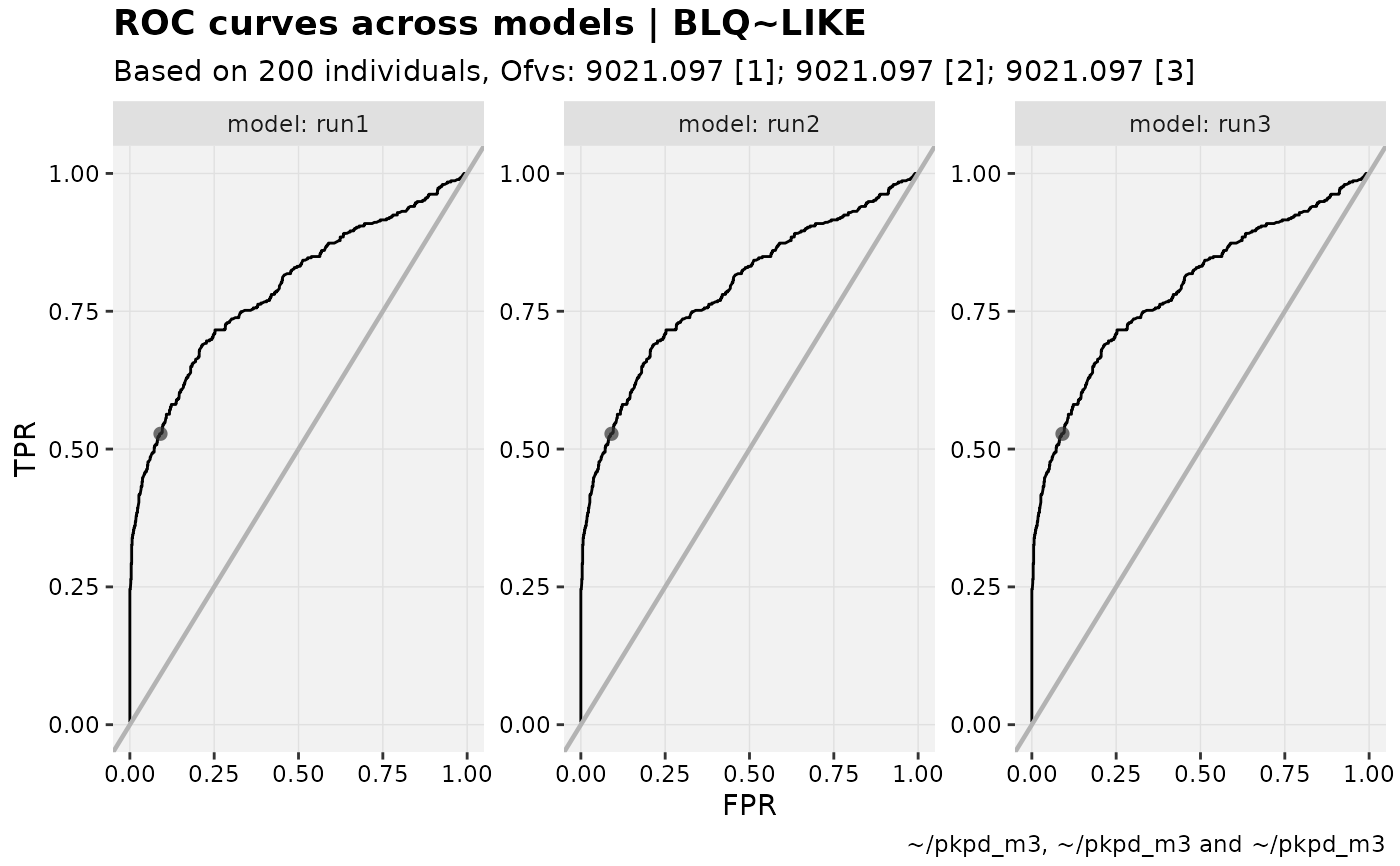
Faceted display of ROC curves across models in a set.
Usage
roc_by_mod(
  xpdb_s,
  ...,
  .lineage = FALSE,
  mapping = NULL,
  cutpoint = 1,
  type = "ca",
  title = "ROC curves across models | @dvcol~@probcol",
  subtitle = "Based on @nind individuals, Ofvs: @ofv",
  caption = "@dir",
  tag = NULL,
  axis.text = "@run",
  facets,
  .problem,
  quiet,
  roc_args = NULL
)
Arguments
- xpdb_s
<
xpose_set> object- ...
Any additional aesthetics.
- .lineage
<
logical> where ifTRUE,...is processed- mapping
ggplot2style mapping- cutpoint
<
numeric> Of defined probabilities, which one to use in plots.- type
See Details.
- title
Plot title
- subtitle
Plot subtitle
- caption
Plot caption
- tag
Plot tag
- axis.text
What to label the model. This is parsed on a per-model basis.
- facets
Additional facets
- .problem
Problem number
- quiet
Silence extra debugging output
- roc_args
Additional arguments to pass to
xplot_rocplot()
Details
For type-based customization of plots:
cROC curve (usinggeom_path)kKey points on ROC curve (where on curve the threshold isthres_fixed) (usinggeom_point)pROC space points (usinggeom_point)tROC space text (usinggeom_text)aAUC in bottom right (usinggeom_label)
Examples
# \donttest{
pkpd_m3 <- pkpd_m3 %>%
  # Need to ensure var types are set
  set_var_types(catdv=BLQ,dvprobs=LIKE) %>%
  # Set probs
  set_dv_probs(1, 1~LIKE, .dv_var = BLQ) %>%
  # Optional, but useful to set levels
  set_var_levels(1, BLQ = lvl_bin())

m3_set <- xpose_set(
  run1=set_prop(pkpd_m3,run="run1"),
  run2=set_prop(pkpd_m3,run="run2"),
  run3=set_prop(pkpd_m3,run="run3")
)

roc_by_mod(m3_set, type = "ck", quiet = TRUE)

# }
# }