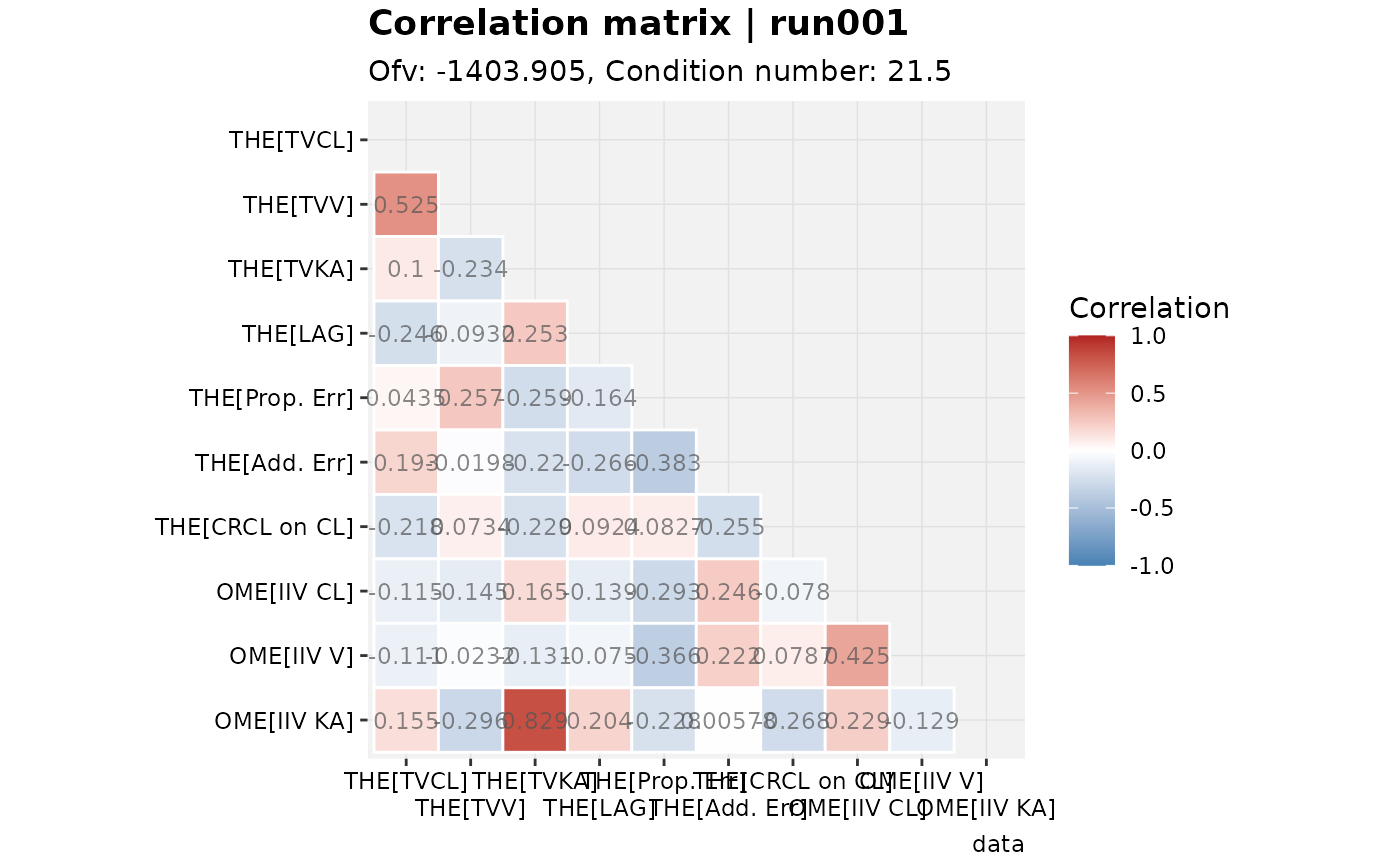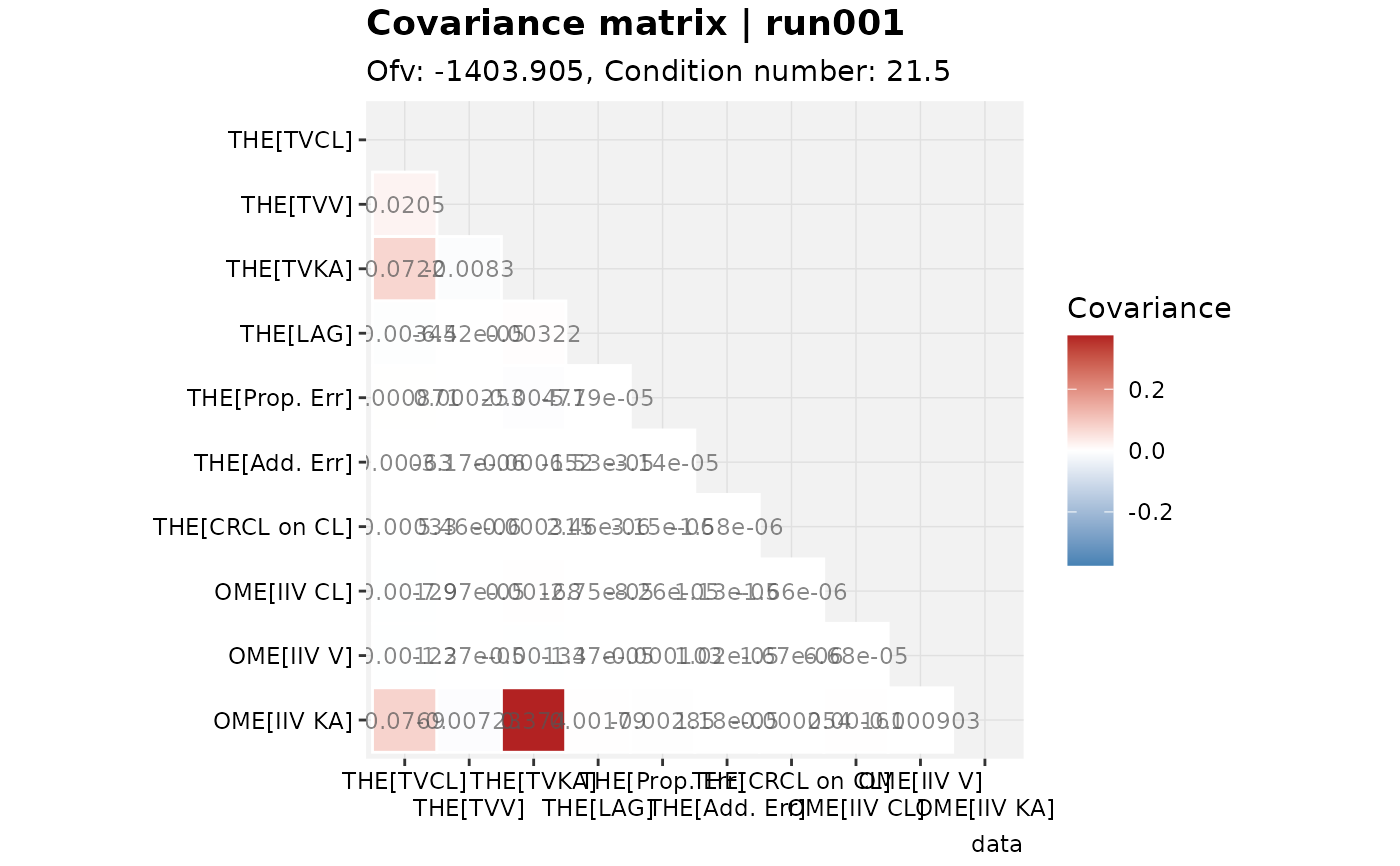
Visualizes the parameter correlation (or covariance) matrix as a heatmap,
filling a gap left behind in translation from xpose4. Values come from
get_cov_matrix(), which has built-in support for nonmem and
nlmixr2 models; rendering is done with the generic xplot_heatmap()
template.
Usage
cormat(
  xpdb,
  type = c("correlation", "covariance"),
  .problem = NULL,
  .subprob = NULL,
  .method = NULL,
  drop_fixed = TRUE,
  digits,
  title,
  subtitle = "Ofv: @ofv, Condition number: @condn",
  caption = "@dir",
  tag = NULL,
  quiet,
  ...
)
Arguments
- xpdb
<
xp_xtras> or <xpose_data> object- type
<
character> Either"correlation"(default) or"covariance"- .problem
<
numeric> Problem number to use. Uses the xpose default if not provided.- .subprob
<
numeric> Subproblem number to use. Uses the xpose default if not provided.- .method
<
character> Method to use. Uses the xpose default if not provided.- drop_fixed
<
logical> Passed toget_cov_matrix()- digits
Number of significant digits to display in cell labels. Defaults to
reportable_digits()- title
Plot title
- subtitle
Plot subtitle
- caption
Plot caption
- tag
Plot tag
- quiet
Silence extra debugging output
- ...
Additional aesthetics, passed to
xplot_heatmap()
Details
Only the upper triangle of the matrix is drawn, as it is symmetric.
Fixed-effect (theta) and random-effect (omega/sigma) parameters are
both included for nonmem models, when available and not fixed. For
nlmixr2 models, only fixed effects are included, as nlmixr2 does not
report uncertainty for random effects. See get_cov_matrix() for
further details on availability; if the covariance step was not run, or
did not complete successfully, an informative error is raised.