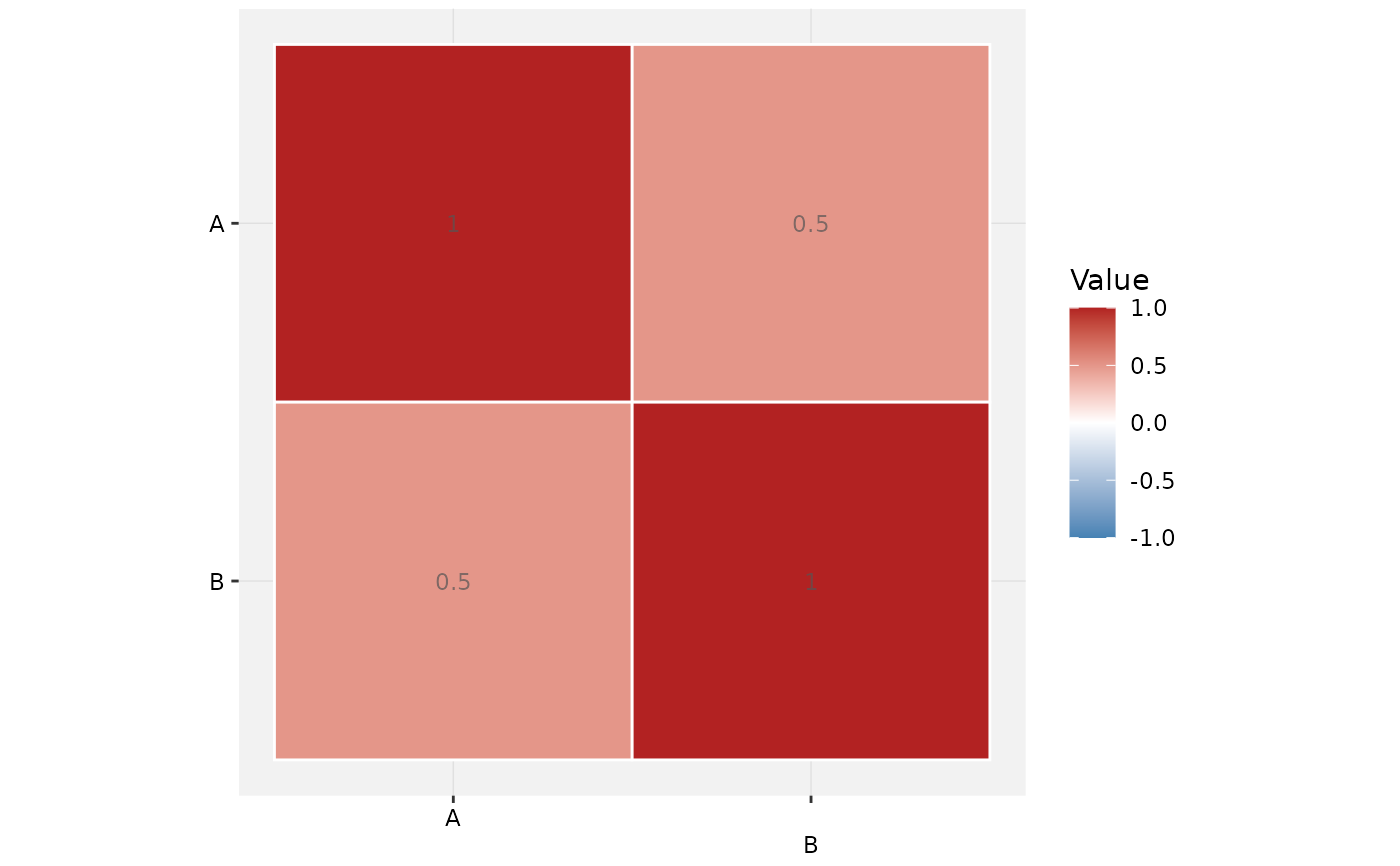
Following the xpose design pattern, this is a generic template
(analogous to xplot_boxplot() or xplot_pairs()) for rendering a
numeric matrix as a themed tile heatmap with cell value labels. It is not
tied to any particular data source; callers are expected to build a named
implementation on top of it (eg, cormat() for parameter
correlation/covariance matrices) rather than calling it directly for
everyday use.
Usage
xplot_heatmap(
  xpdb,
  mat,
  digits = 3,
  limits = NULL,
  midpoint = 0,
  legend_name = "Value",
  title = NULL,
  subtitle = NULL,
  caption = NULL,
  tag = NULL,
  plot_name = "heatmap",
  gg_theme,
  xp_theme,
  quiet,
  ...
)
Arguments
- xpdb
<
xp_xtras> or <xpose_data> object. Used only for theming;matis plotted as-is.- mat
A numeric matrix with row and column names.
NAcells are dropped (not plotted), which can be used to mask out redundant cells (eg, the lower triangle of a symmetric matrix).- digits
Number of significant digits to display in cell labels
- limits
Fill scale limits, as
c(low, high). Defaults toc(-1, 1) * max(abs(mat), na.rm = TRUE)- midpoint
Fill scale midpoint
- legend_name
Fill scale/legend title
- title
Plot title
- subtitle
Plot subtitle
- caption
Plot caption
- tag
Plot tag
- plot_name
Metadata name of plot
- gg_theme
As in
xpose- xp_theme
As in
xpose- quiet
Silence extra debugging output
- ...
Additional aesthetics, passed to the
heatmaptile layer andheatmaptxtlabel layer (seexp_xtra_theme())