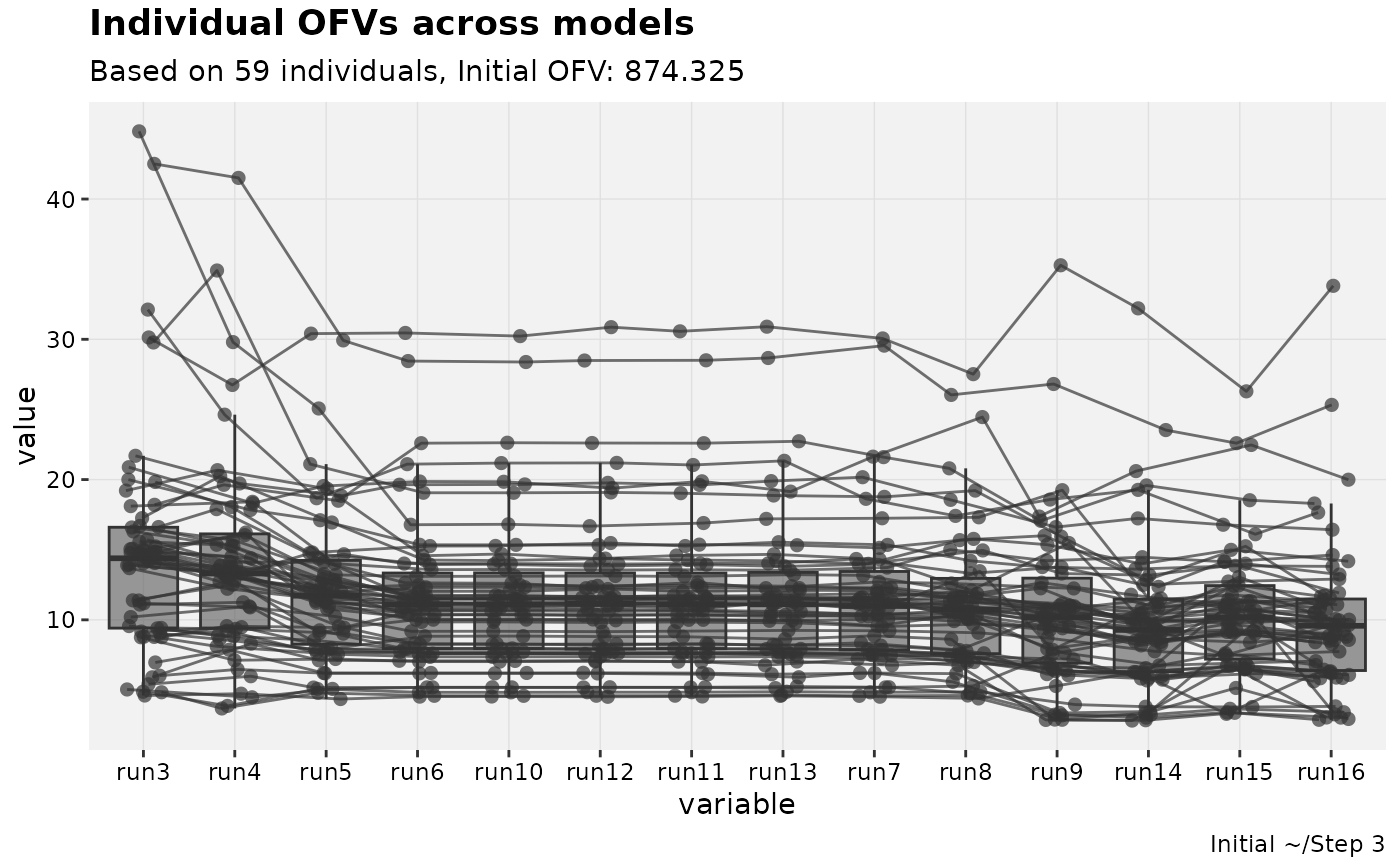
Another visualization of how individual objective functions change over the course of model development.
Usage
iofv_vs_mod(
  xpdb_s,
  ...,
  .lineage = FALSE,
  auto_backfill = FALSE,
  mapping = NULL,
  orientation = "x",
  type = "bjc",
  title = "Individual Ofvs across models",
  subtitle = "Based on @nind individuals, Initial Ofv: @ofv",
  caption = "Initial @dir",
  tag = NULL,
  axis.text = "@run",
  facets,
  .problem,
  quiet
)
Arguments
- xpdb_s
<
xpose_set> object- ...
<
tidyselect> of models in set. If empty, all models are used in order of their position in the set. May also use a formula, which will just be processed withall.vars().- .lineage
<
logical> where ifTRUE,...is processed- auto_backfill
<
logical> IfTRUE, apply <backfill_iofv()> automatically.FALSEby default to encourage data control as a separate process to plotting control.- mapping
ggplot2style mapping- orientation
Defaults to
x- type
Passed to <
xplot_boxplot>- title
Plot title
- subtitle
Plot subtitle
- caption
Plot caption
- tag
Plot tag
- axis.text
What to label the model. This is parsed on a per-model basis.
- facets
Additional facets
- .problem
Problem number
- quiet
Silence output
Examples
# \donttest{

pheno_set %>%
  focus_qapply(backfill_iofv) %>%
  iofv_vs_mod()
#> Using data from $prob no.1
#> Removing duplicated rows based on: ID
#> Tidying data by ID, TIME, AMT, WT, APGR ... and 17 more variables


pheno_set %>%
  focus_qapply(backfill_iofv) %>%
  iofv_vs_mod(run3,run11,run14,run15)
#> Using data from $prob no.1
#> Removing duplicated rows based on: ID
#> Tidying data by ID, TIME, AMT, WT, APGR ... and 17 more variables


pheno_set %>%
  focus_qapply(backfill_iofv) %>%
  iofv_vs_mod(.lineage = TRUE)
#> Using data from $prob no.1
#> Removing duplicated rows based on: ID
#> Tidying data by ID, TIME, AMT, WT, APGR ... and 17 more variables


# }
# }
