
Mirrors eta_vs_catcov(), but for the per-individual shrinkage
contribution diagnostic (shk type columns, see
derive_shk()/backfill_shk()) instead of the etas themselves.
Usage
shk_vs_catcov(
  xpdb,
  mapping = NULL,
  shkvar = NULL,
  covvar = NULL,
  drop_fixed = TRUE,
  orientation = "x",
  show_n = check_xpdb_x(xpdb, .warn = FALSE),
  type = "bol",
  list = TRUE,
  title = "Shrinkage contribution versus categorical covariates | @run",
  subtitle = "Based on @nind individuals",
  caption = "@dir",
  tag = NULL,
  facets,
  .problem,
  quiet,
  ...
)
Arguments
- xpdb
<
xp_xtras> or <xpose_data> object- mapping
ggplot2style mapping- shkvar
tidyselectforshkvariables- covvar
tidyselectfor categorical covariate variables;NULL(default) selects every categorical covariate in thexpdbdata index.- drop_fixed
As in
xpose- orientation
Passed to
xplot_boxplot- show_n
Add "N=" to plot
- type
Passed to
xplot_boxplot- list
<
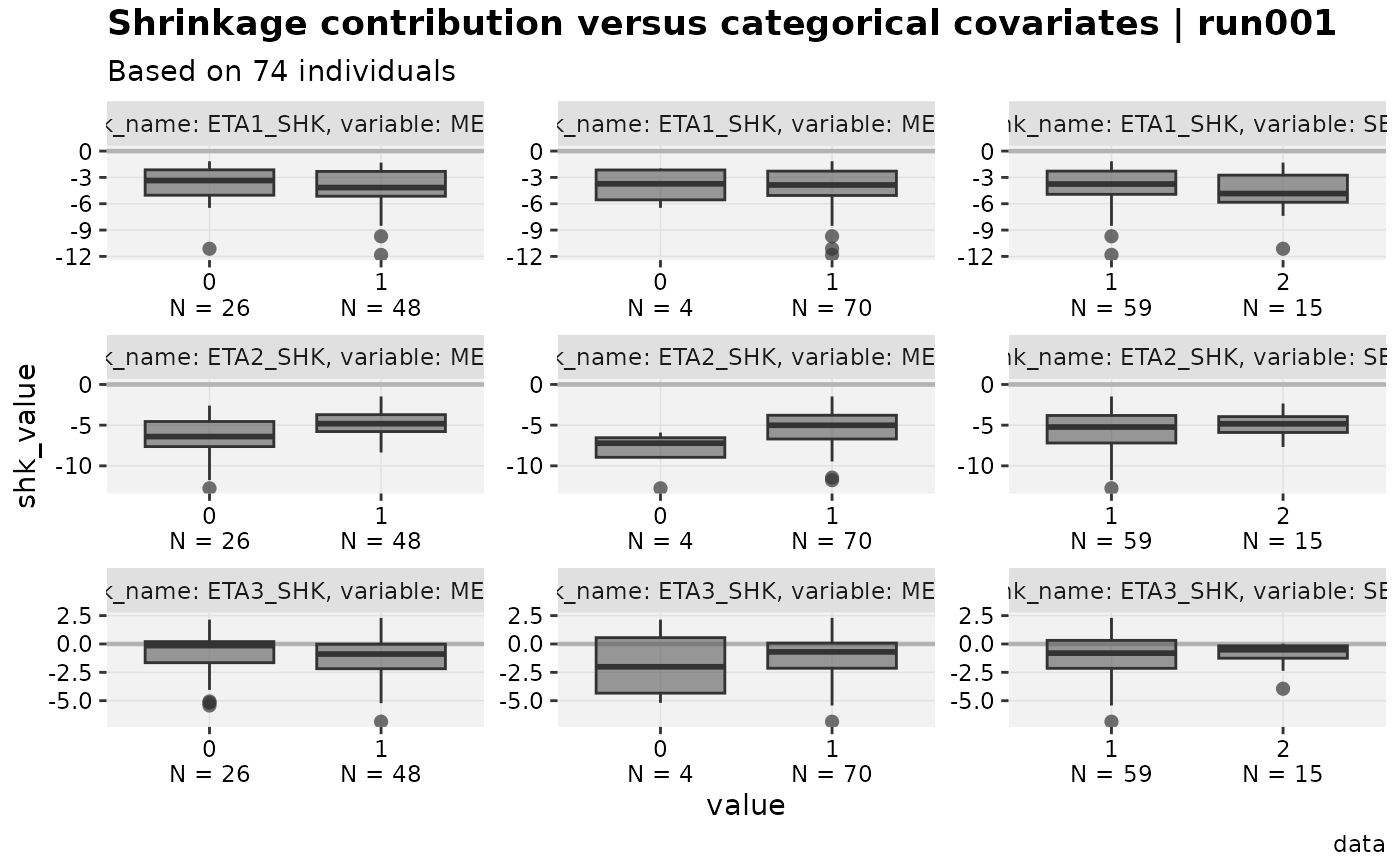
logical> Only relevant whenshkvarresolves to more than oneshkcolumn. IfTRUE(default, for backwards compatibility), returns a plain list of one plot pershkcolumn. IfFALSE, they are instead combined onto one shared plot – faceted byshkcolumn, in addition to the existing per-covariate facet – automatically paginating (at most 9 panels per page, i.e.ncol/nrowof 3) viaxpose's ownfacet_wrap_paginatemechanism. Printing the returned plot renders every page; passpagetoprint()to select a specific one.- title
Plot title
- subtitle
Plot subtitle
- caption
Plot caption
- tag
Plot tag
- facets
Additional facets
- .problem
Problem number
- quiet
Silence output
- ...
Any additional aesthetics.
Value
The desired plot, or (when shkvar resolves to more than one
shk column and list = TRUE) a plain list of one plot per column.
Examples
# \donttest{
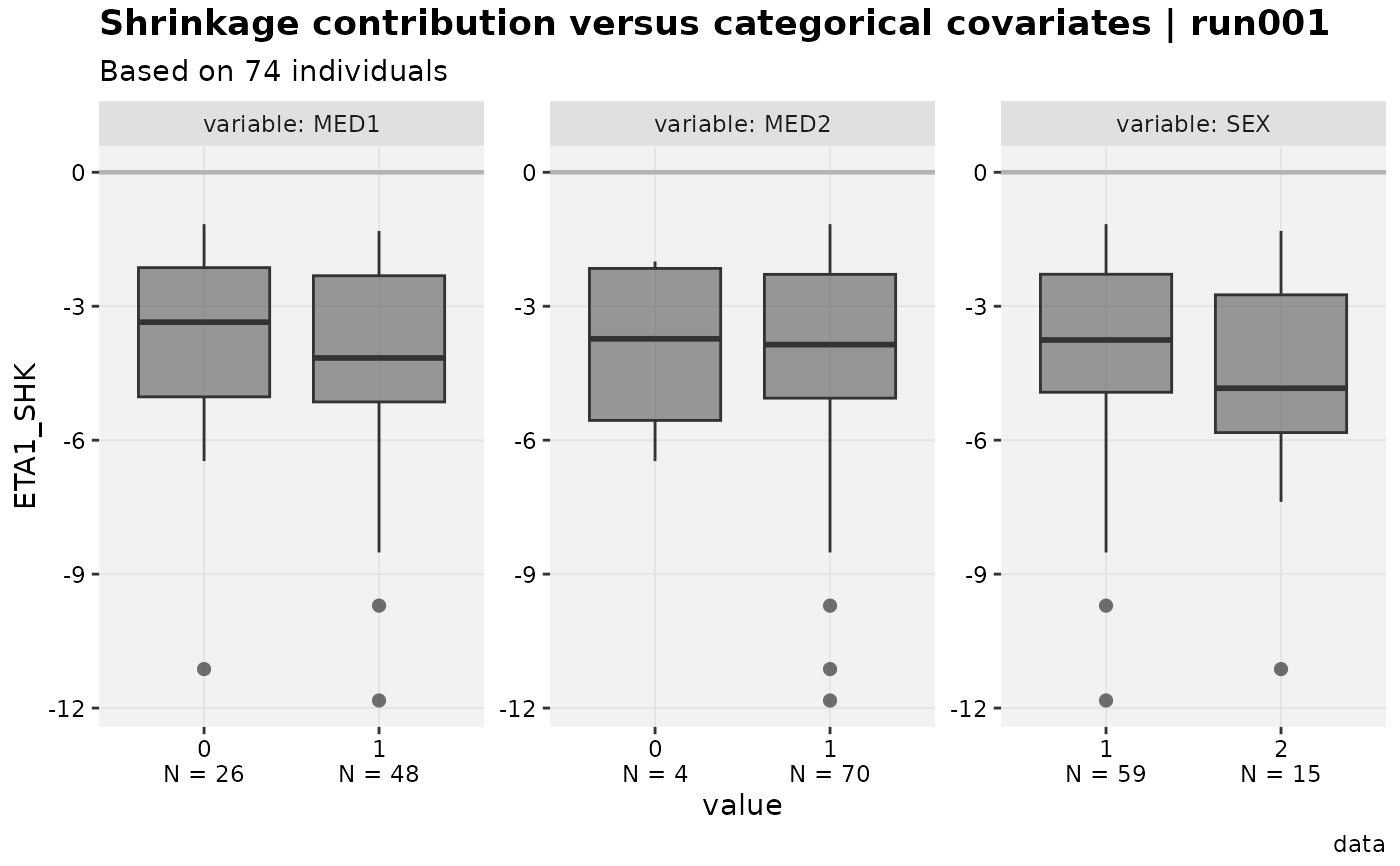
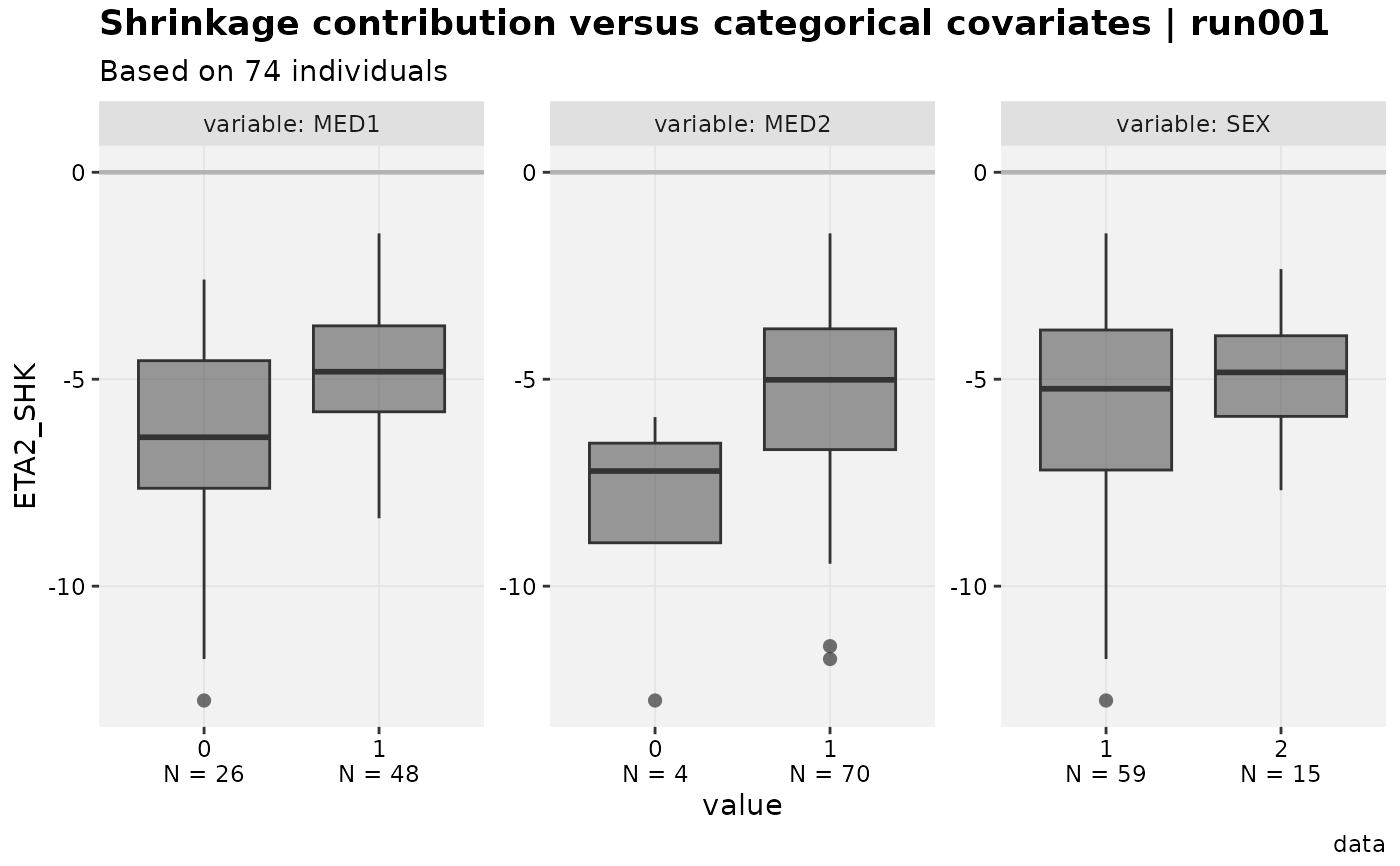
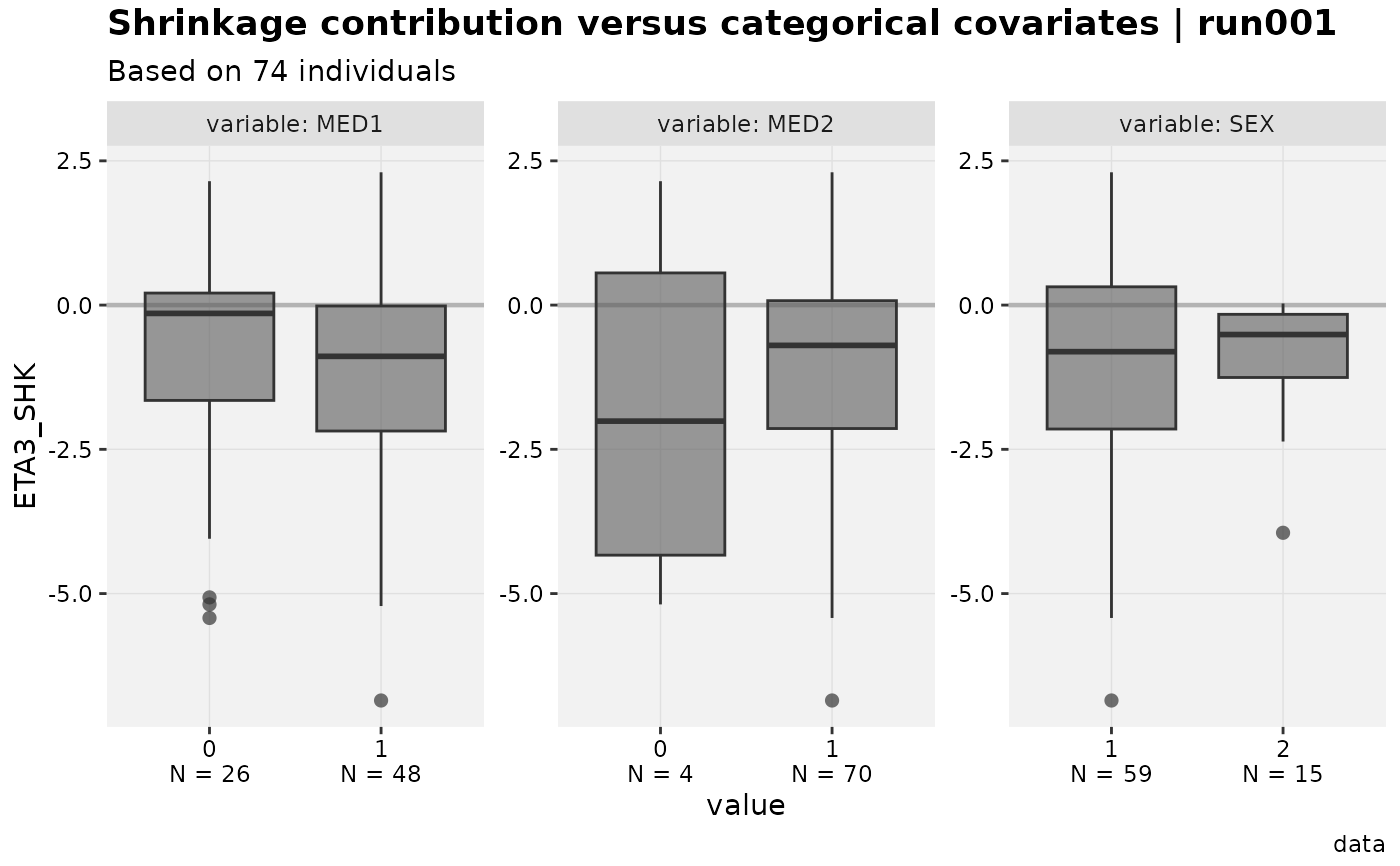
xpdb_x %>%
backfill_shk() %>%
shk_vs_catcov()
#> Using data from $prob no.1
#> Removing duplicated rows based on: ID
#> Tidying data by ID, DOSE, AMT, SS, II ... and 26 more variables
#> Warning: attributes are not identical across measure variables; they will be dropped
#> Using data from $prob no.1
#> Removing duplicated rows based on: ID
#> Tidying data by ID, DOSE, AMT, SS, II ... and 26 more variables
#> Warning: attributes are not identical across measure variables; they will be dropped
#> Using data from $prob no.1
#> Removing duplicated rows based on: ID
#> Tidying data by ID, DOSE, AMT, SS, II ... and 26 more variables
#> Warning: attributes are not identical across measure variables; they will be dropped
#> [[1]]
 #>
#> [[2]]
#>
#> [[2]]
 #>
#> [[3]]
#>
#> [[3]]
 #>
# Combine all shk columns onto one shared, faceted plot instead of a list
xpdb_x %>%
backfill_shk() %>%
shk_vs_catcov(list = FALSE)
#> Using data from $prob no.1
#> Removing duplicated rows based on: ID
#> Tidying data by ID, DOSE, AMT, SS, II ... and 26 more variables
#> Warning: attributes are not identical across measure variables; they will be dropped
#>
# Combine all shk columns onto one shared, faceted plot instead of a list
xpdb_x %>%
backfill_shk() %>%
shk_vs_catcov(list = FALSE)
#> Using data from $prob no.1
#> Removing duplicated rows based on: ID
#> Tidying data by ID, DOSE, AMT, SS, II ... and 26 more variables
#> Warning: attributes are not identical across measure variables; they will be dropped
 # }
# }